Mikayla's Digital Portfolio
Piecewise or Propaganda
In this project, we used piecewise functions to create images of either something we felt seniors should know, or to depict a peaceful place. The importance of using peicewise functions to create our images was to insure that they would pass the vertical line test. The vertical line test is used to tell whether a line is a function or not. If a vertical line can be passed along the graph without touching any two points at the same time, everything on the graph is a function. However, lines go on infinitely in both directions, so if there is more than one function graphed, the vertical line test is failed. In order to pass the vertical line test, and combine related functions, we put boundries on each function. An example of a piecewise function, called such because it is made up of many pieces, is shown below:

I chose to create an image of a peaceful place. I didn't have anything imparticular to say to my class, and it seemed a little pretentious, as I don't know what I'm doing anyway. My image depicts a person sitting below a tree, watching the sunrise. Very cheesy, but the idea of having the time to sit and admire something beautiful seems quite peaceful. I also constructed my image with the idea that I wanted to use non-linear functions. I also ended up using non functions as well, but split them up into different piecewise functions in order to allow them to pass the vertical line test. I used one vertical hyperbola to create my tree trunk, and a circle to create the head of my stick figure person. Parabolas make up the curves of my tree, and the end of the hill. During this project, I learned how to find the equations of parabolas, specifically how to find the a in front of x^2. Previously, I would just use Desmos or another computer program and play with the a value until I had the correct parabola. I knew what a did, but I am really excited to have found a way to plug in every other number and solve for it. Whether I end up doing more with quadratics, I am excited to have learned how to come up with their equations. Overall, this project went fairly well for me, however I did one in to one thing which frustrated me. I made my rough draft, and found the equations of my lines from that draft. I wrote them all down in my notebook, and then went to graph them on a larger piece of paper. I had more room on this other paper, and the grid was spaced out more. When I correctly graphed my lines from my rough draft, they did not fit right, or meet at the places I wanted them to. I had to adjust my equations, which was frustrating, because I had already made them. Sometimes I had difficulty figuring out if I went wrong when I copied it, or when I actually found the equation. I ended up just using the points I saw on my draft, and making sure that the lines matched on my final. Then I plugged in my (x,y) from my final into the equation I found earlier, and tweaked what I needed in order to make the equation true. This project as a whole reinforced the key concept that piecewise functions can be used to make individual lines pass the vertical line test. For example, my cirle would not have passed the test unless it was split into two piecewise functions. Also, I had to find the correct boundaries for my lines, and make sure that they did not overlap any other line that I had in the same piecewise function.

I used different piecewise equations in my image above, which correspond to different colors:
Light Blue:
Brown:
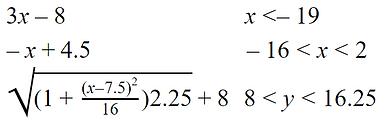
Black:
Pink: